Search any ZIP. See rents, prices, and cash flow instantly.
Decision-First Rental Investing.
Heatmap Housing is a decision-intelligence platform for rental investors scaling portfolios. Discover high-cash-flow markets, model real deal assumptions, and move from ZIP search to agent-ready offer in minutes.
Why This Is Different
One Platform That Replaces Your Deal Stack.
Market discovery + modeled underwriting + export-ready execution — with sourced assumptions you can audit.
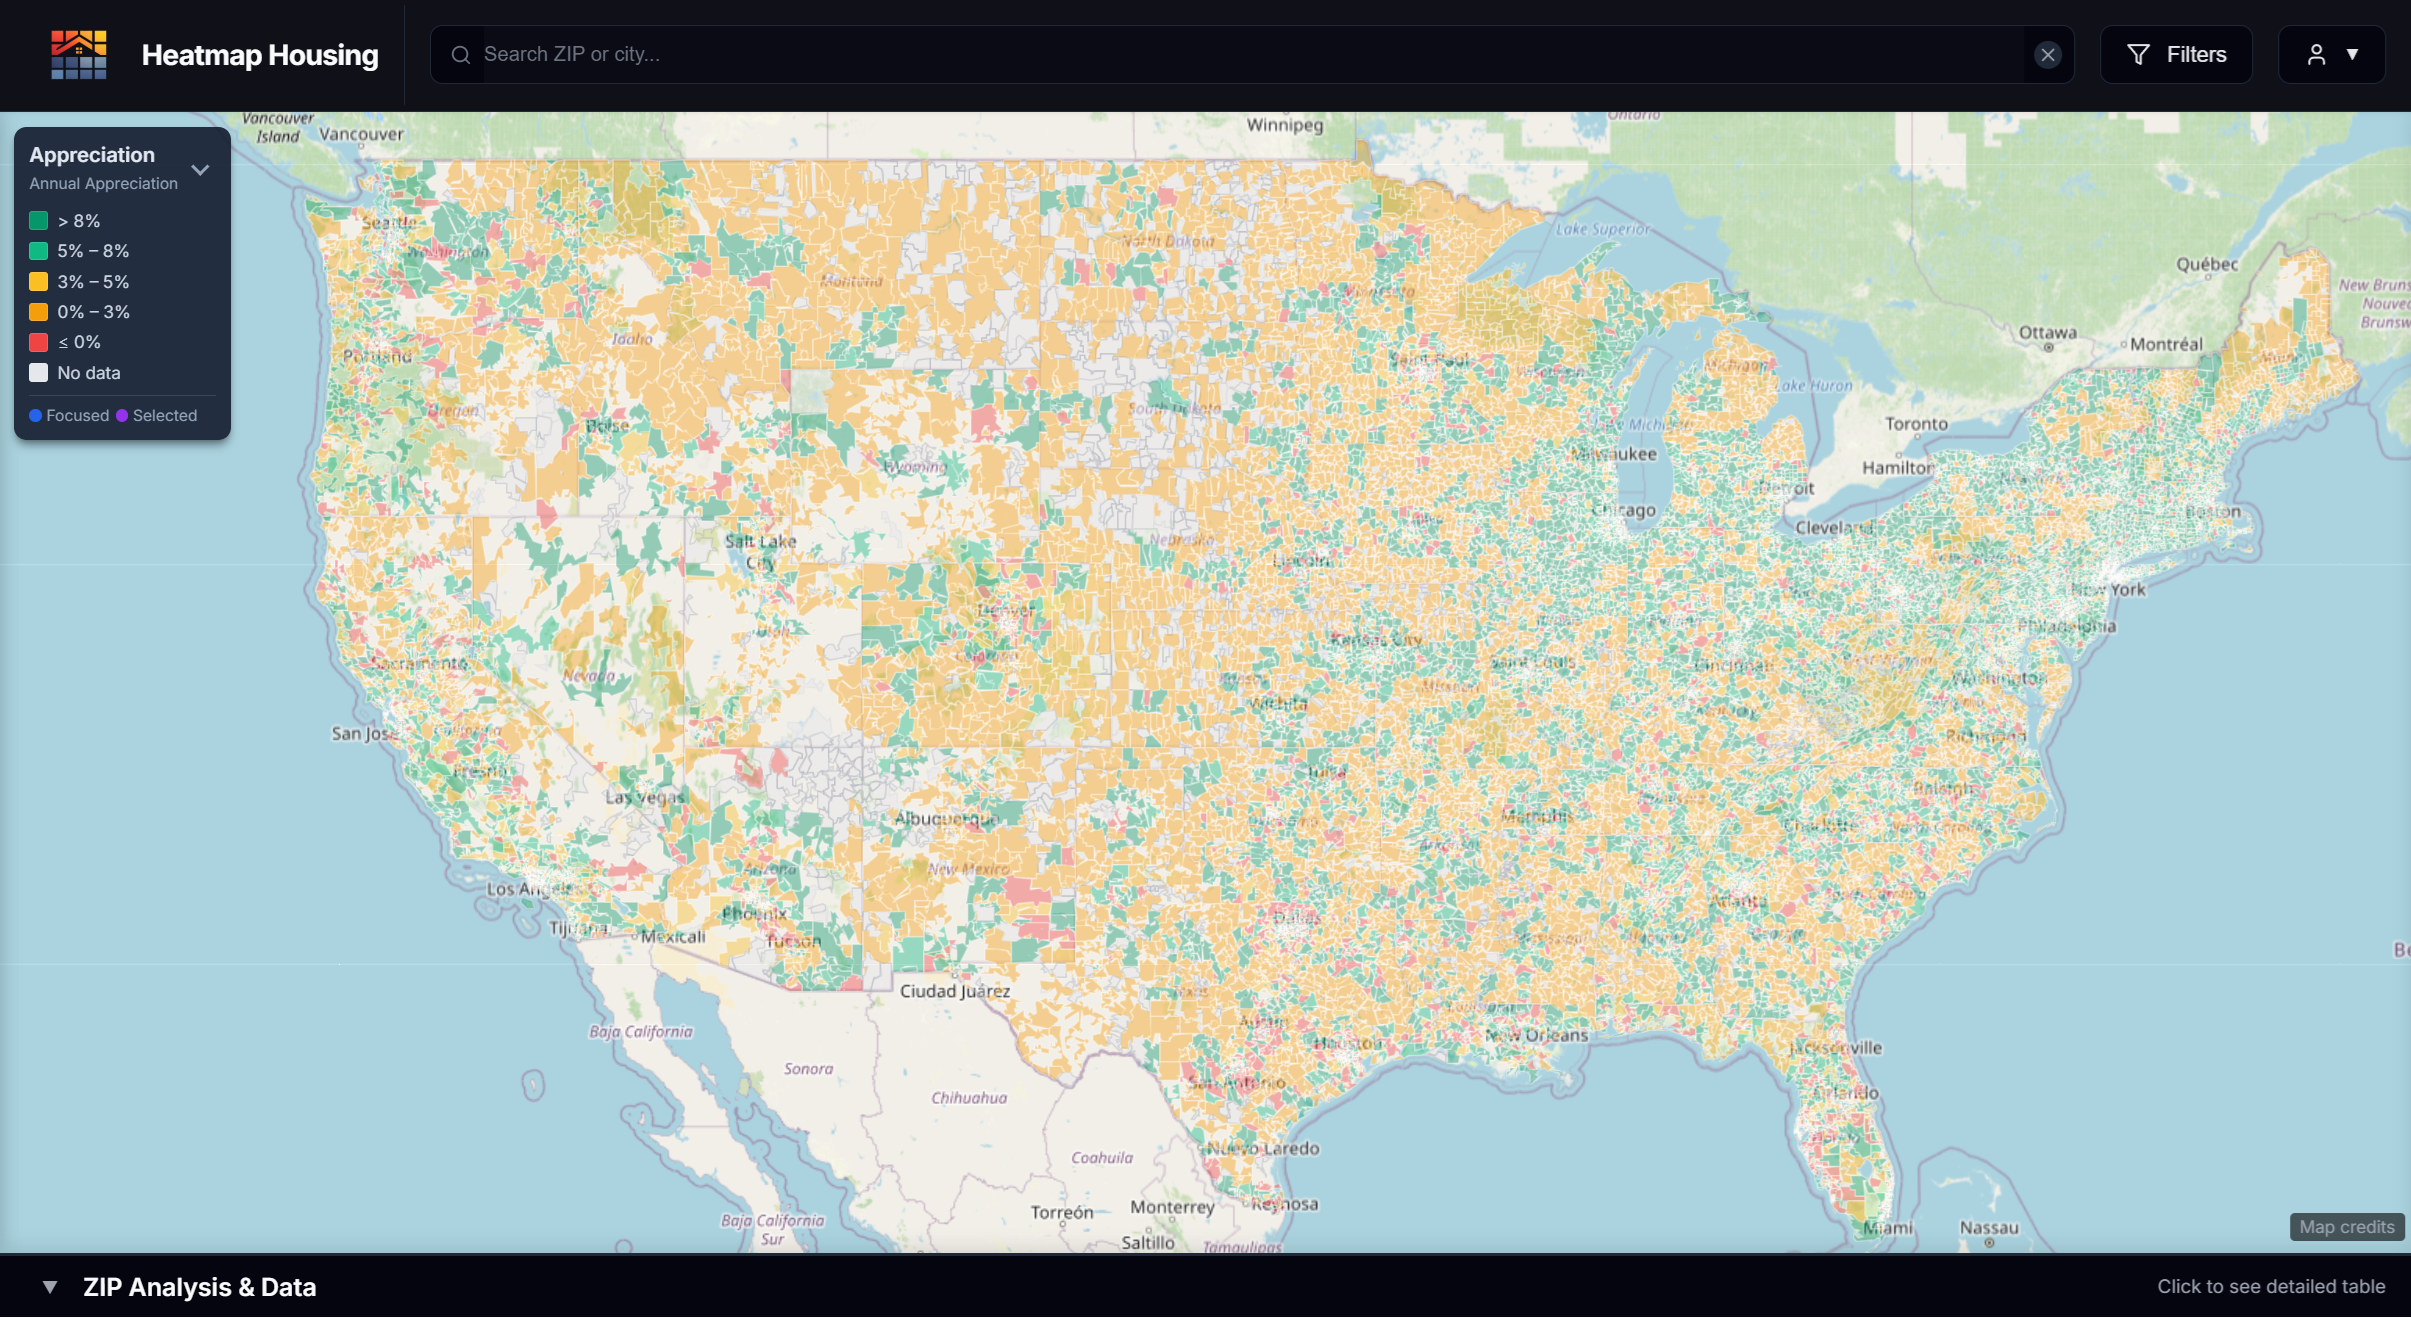
Visualization-First
See the entire country as a live heatmap. Filter by your criteria and spot opportunity fast — before you waste time underwriting listings.
ZIP → Property in One Click
Start at the market level, then drill into a single property without switching tools. Listings, rent comps, tax history, and underwriting — in one view.
Every Number Is Auditable
No black boxes. Each assumption shows its source and a confidence indicator so you can verify, override, and move forward with clarity.
Instant & Fully Hosted
No installs. No downloads. Open your browser and the platform is live — markets, properties, underwriting, and exports.
Your Process Is the Bottleneck
Effort isn’t the problem. Workflow is.
The Old Way
- Scan listings one by one
- Build spreadsheets for every property
- Guess at rent, taxes, and insurance
- Research comps manually or across several platforms
- Waste hours underwriting deals you never offer on
- Miss stronger markets because you don’t have time to compare them
Scaling investors don’t lose because they lack effort.
They lose because their process doesn’t scale.
The Heatmap Housing Way
- Filter U.S. ZIP codes by modeled cash flow, DSCR, and price range
- See projected rent, tax, insurance, and expense assumptions instantly
- Compare rent comps, sale comps, and tax history in one view
- Identify viable deals before contacting an agent
- Export structured deal summaries ready for partners or lenders
This isn’t more data.
It’s faster capital allocation.
The Full Workflow
From Market Unknown to Offer-Ready
Market Discovery
- Scan the entire U.S. by ZIP code using cash flow, rent estimates, and investment criteria
- Filter by what matters — not just price
- Identify high-potential markets you wouldn’t find manually
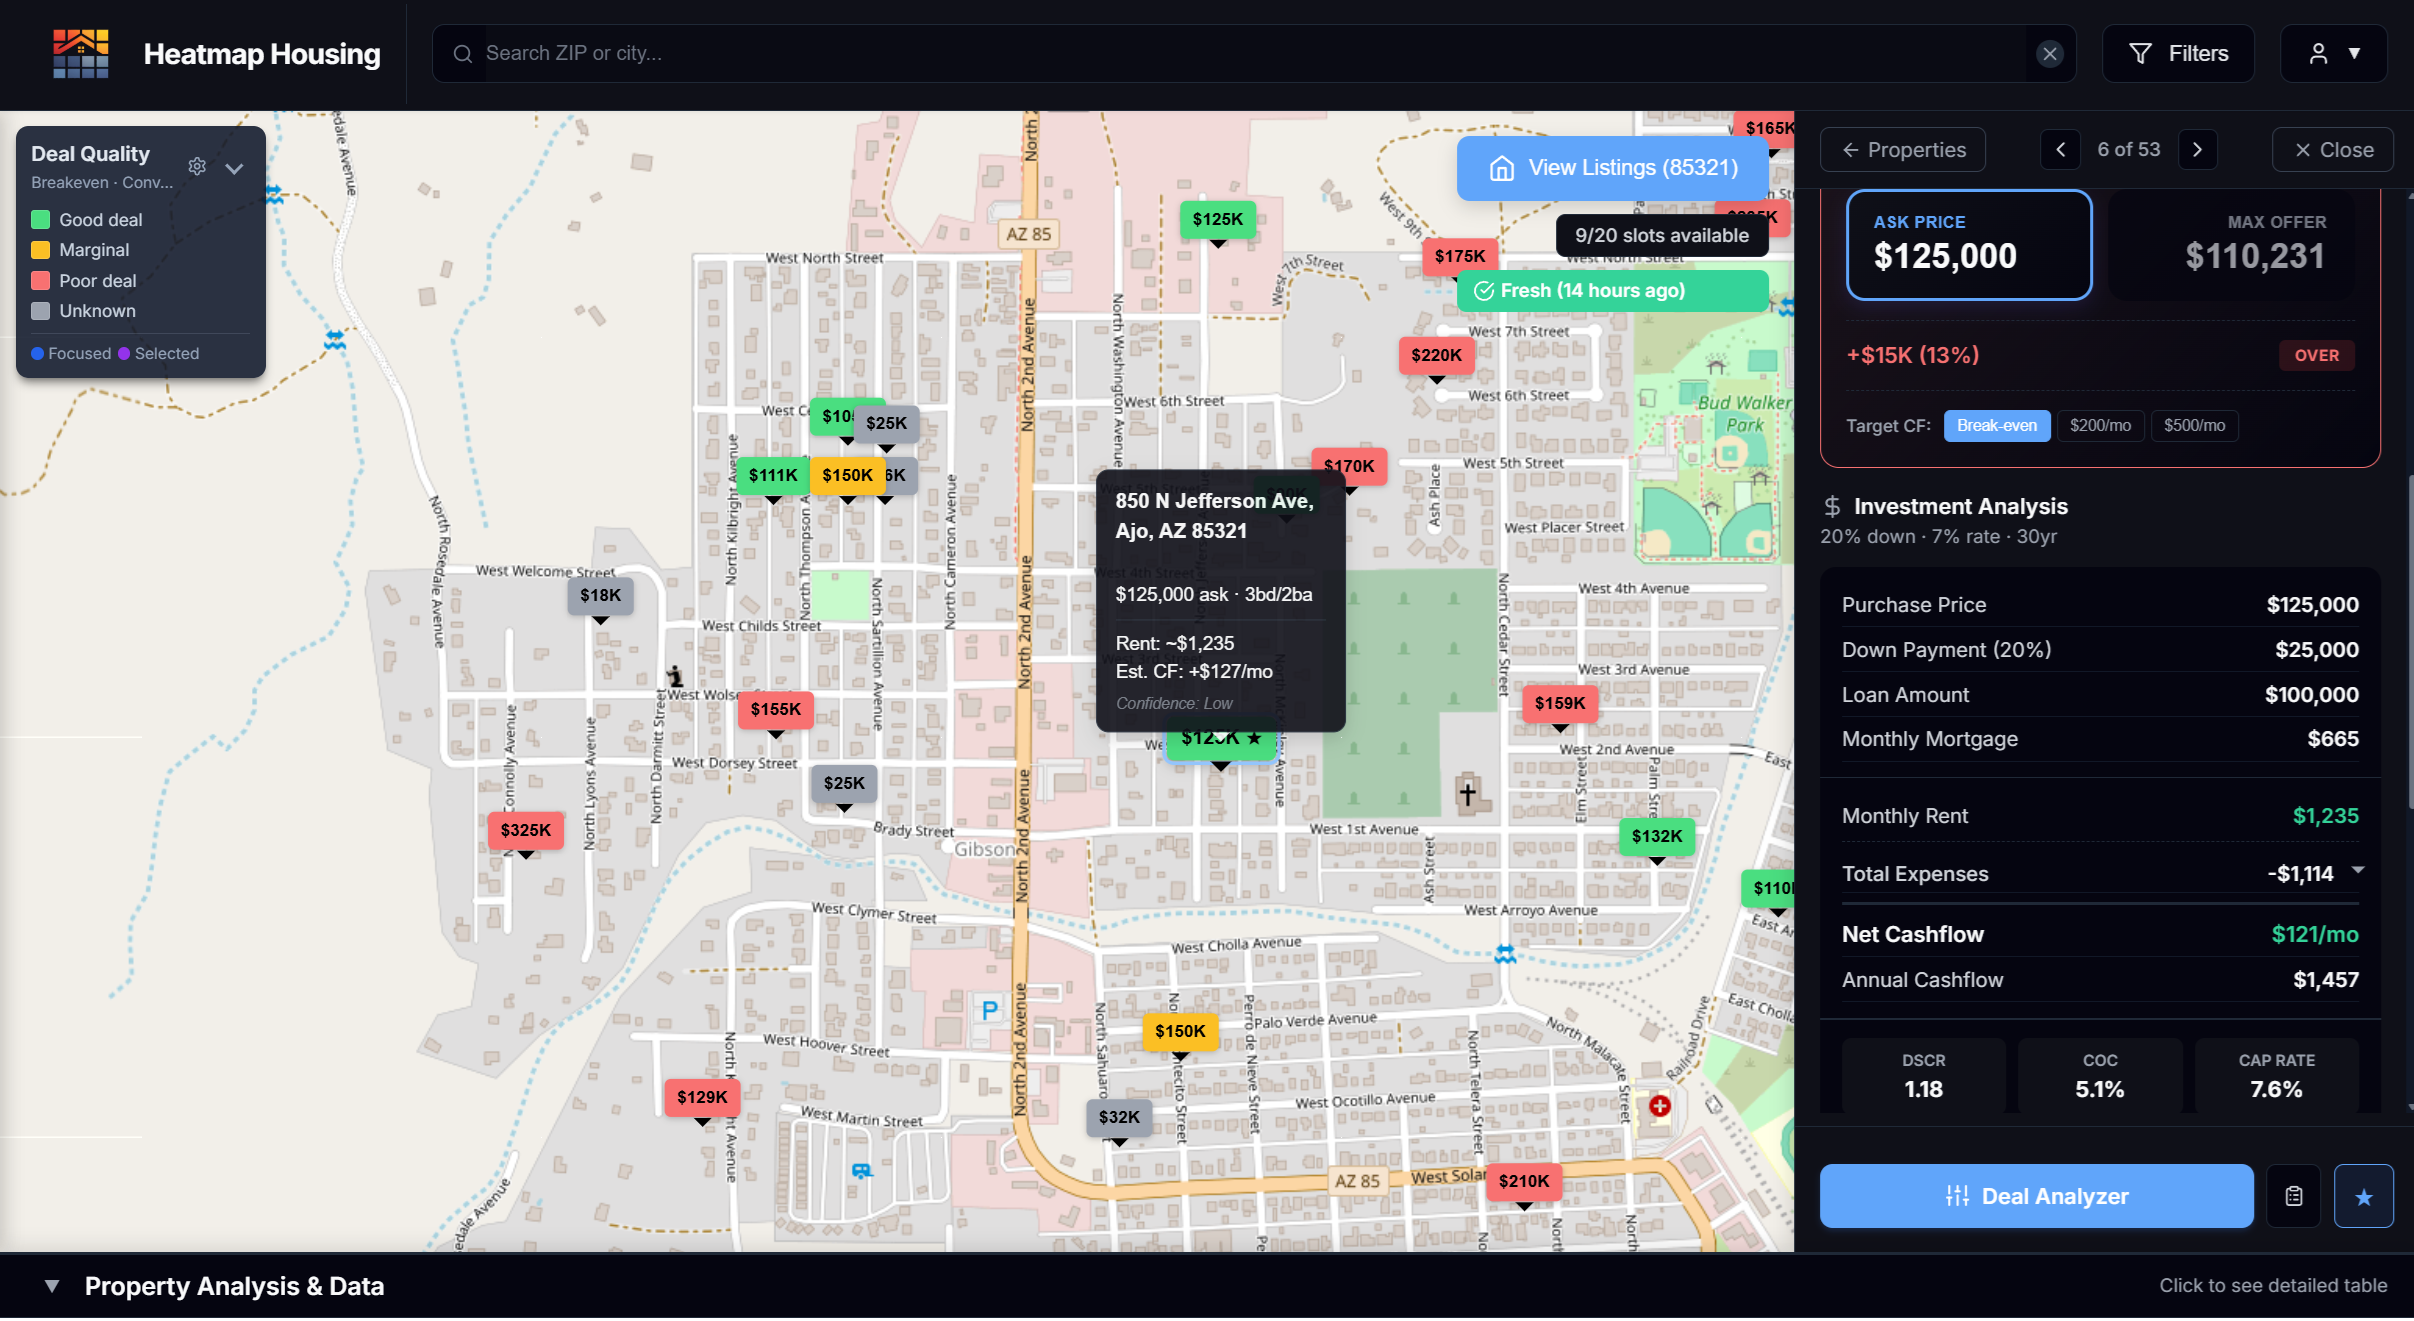
Instant Modeled Underwriting
- View projected cash flow, DSCR, and expense assumptions pre-filled
- Adjust inputs instead of building spreadsheets from scratch
- Every field shows its source and confidence level
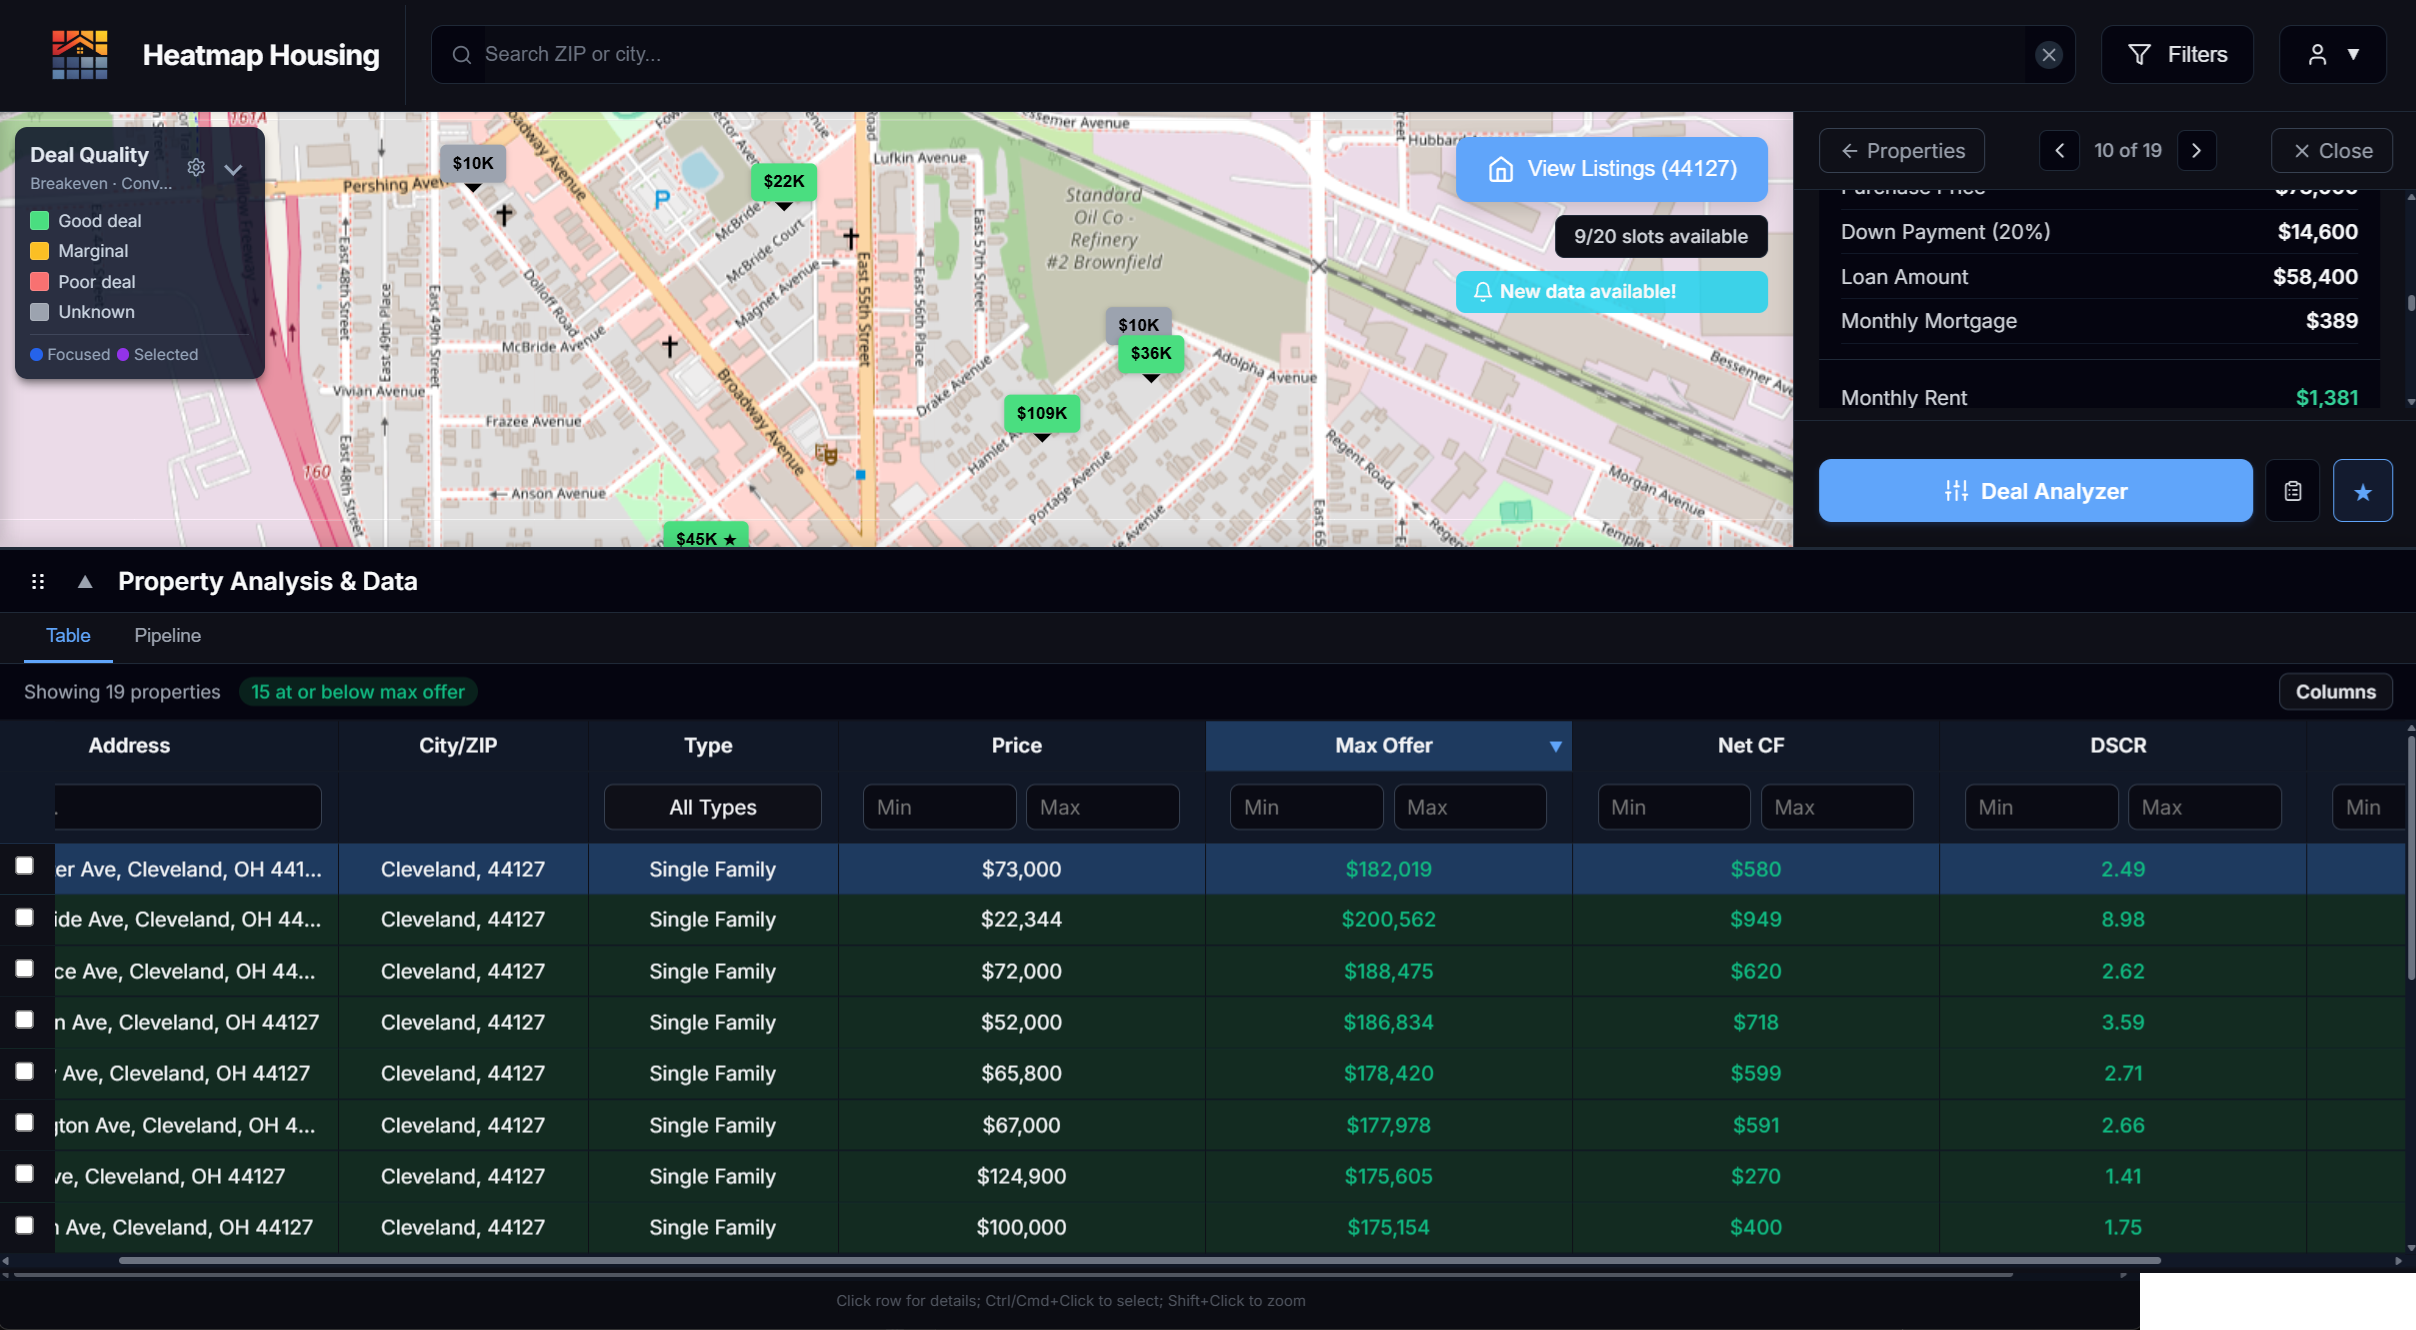
Property-Level Deep Dive (Pro)
- Analyze individual listings with rent comps and expense modeling
- Confidence indicators on every data point
- Override any value — the analysis recalculates instantly
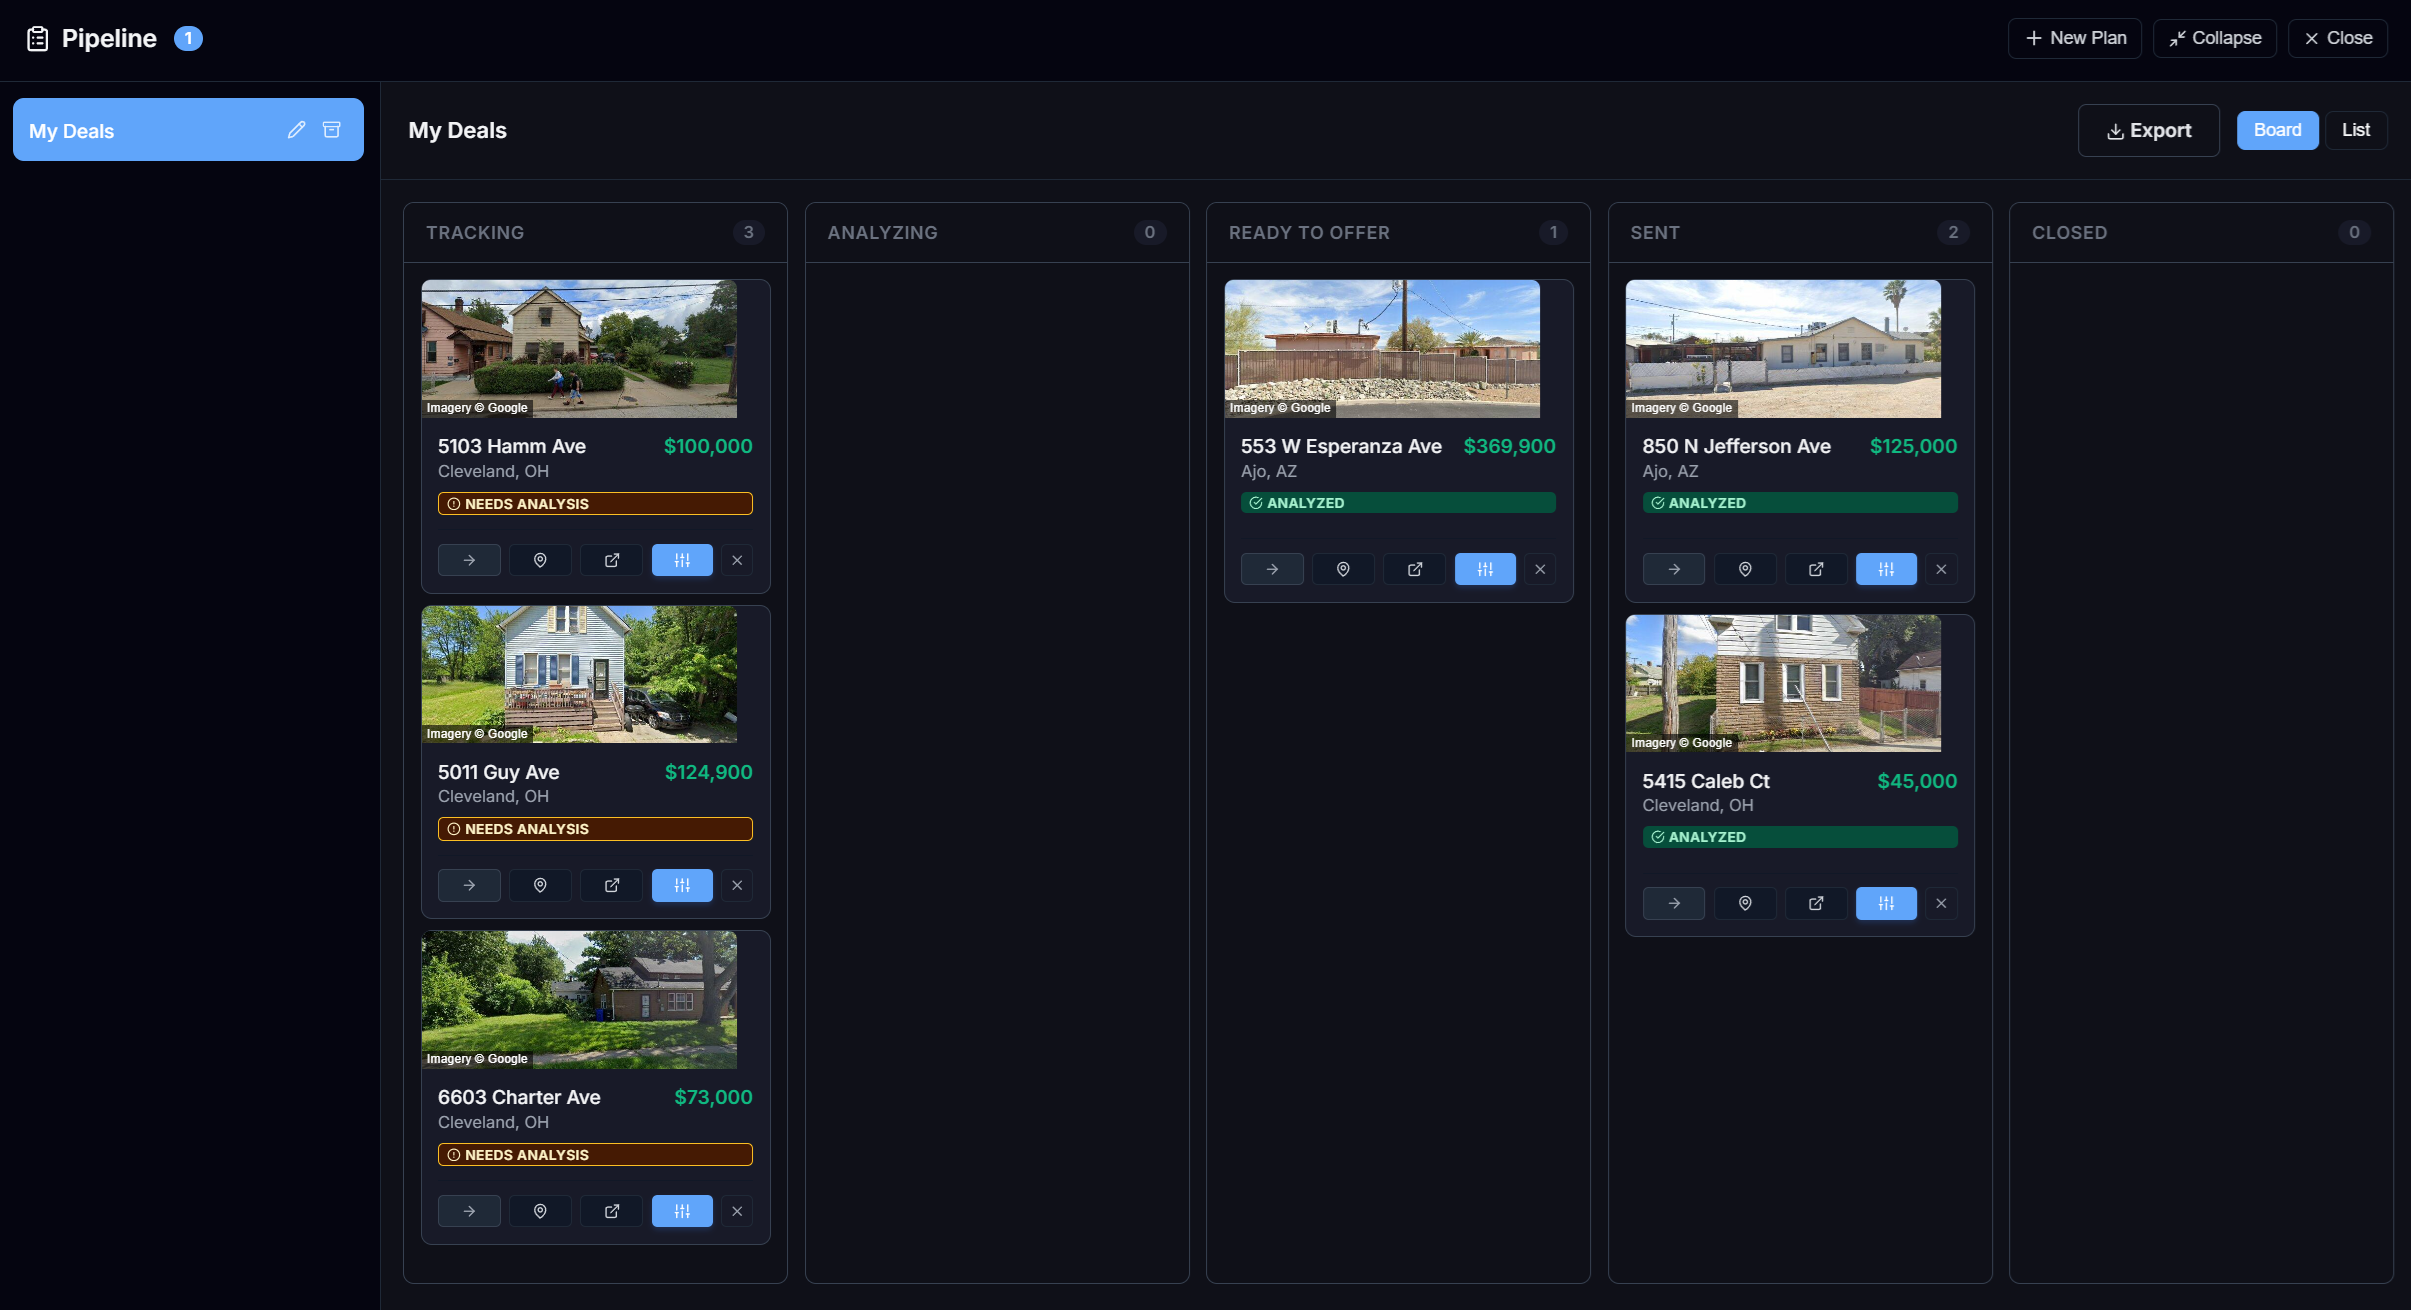
Export & Execute
- Download structured deal summaries
- Send clean, organized numbers to agents, partners, or lenders
- Track deals from discovery to close
Map to Offer in Minutes
See the entire workflow in under 2 minutes
Filter 30,000+ ZIP codes by your criteria. Click a market. See real numbers. Free to explore — no credit card.
Trusted Data, Full Transparency
Real numbers from real sources — every one auditable
HUD Fair Market Rent
Government-published rent baselines updated annually by HUD. ZIP-level (SAFMR) and metro-level (FMR) data for voucher rent underwriting.
MLS & Listing Data
Active listings refreshed daily. Rental comps and sale comps from MLS-derived data feeds. Property-level data enriched every 30 days.
Census & Demographics
Population, median household income, unemployment rate, and growth trends. Updated annually from U.S. Census Bureau data.
Sale & Tax Records
Ownership records, tax assessments, deed history, and transaction data from county-level public records.
How it works: ZIP-level analysis combines HUD Fair Market Rent data, actual median sale prices, Census demographics, and MLS data — pre-calculated and ranked based on your criteria. Each ZIP includes a Data Quality grade so you know how much data backs the estimates.
Property-level: Every underwriting field is pre-filled from sourced data — rent comps, taxes, insurance estimates — each with a confidence indicator. Adjust any value to match your deal. The analysis updates instantly.
Data freshness: Listings refresh daily — you always have yesterday’s data. Market heatmaps update monthly. Property enrichment (ownership, tax, comps) refreshes every 30 days. Pro unlocks current-month snapshots — no rolling averages, just now.
Confidence indicators: Every field in the Deal Analyzer shows a badge indicating how the number was derived. If a rent estimate is based on nearby rental comps, you’ll see that. If a tax value comes from county records vs. an estimate, you’ll see that too. You know exactly what backs each number — and you can override any value if your local knowledge is better.
Built for How You Actually Invest
Three investors, three workflows, one platform
The Out-of-State Investor
Screen 15 markets in an hour, not a week. See which ZIPs actually cash flow before you ever call an agent. Toggle between market rent and voucher rent to find the strategy that works for each market — all from your browser, no local knowledge required to start.
The BRRRR Investor
Model the full cycle — purchase, rehab, rent, refinance — with real numbers, not guesses. The Deal Analyzer calculates your cash left in deal and post-refi cash flow, then gives you a clear verdict: does this BRRRR work, partially work, or fail? Know before you commit capital.
The First-Time Investor
Every number shows where it came from. No spreadsheet required. Start with the heatmap, find green ZIPs, drill into properties, and get a full underwriting with confidence indicators on every field. You’ll know what to trust before you make an offer.
Stop Underwriting Deals You’ll Never Offer On.