The Full Workflow
From Market Unknown to Offer-Ready
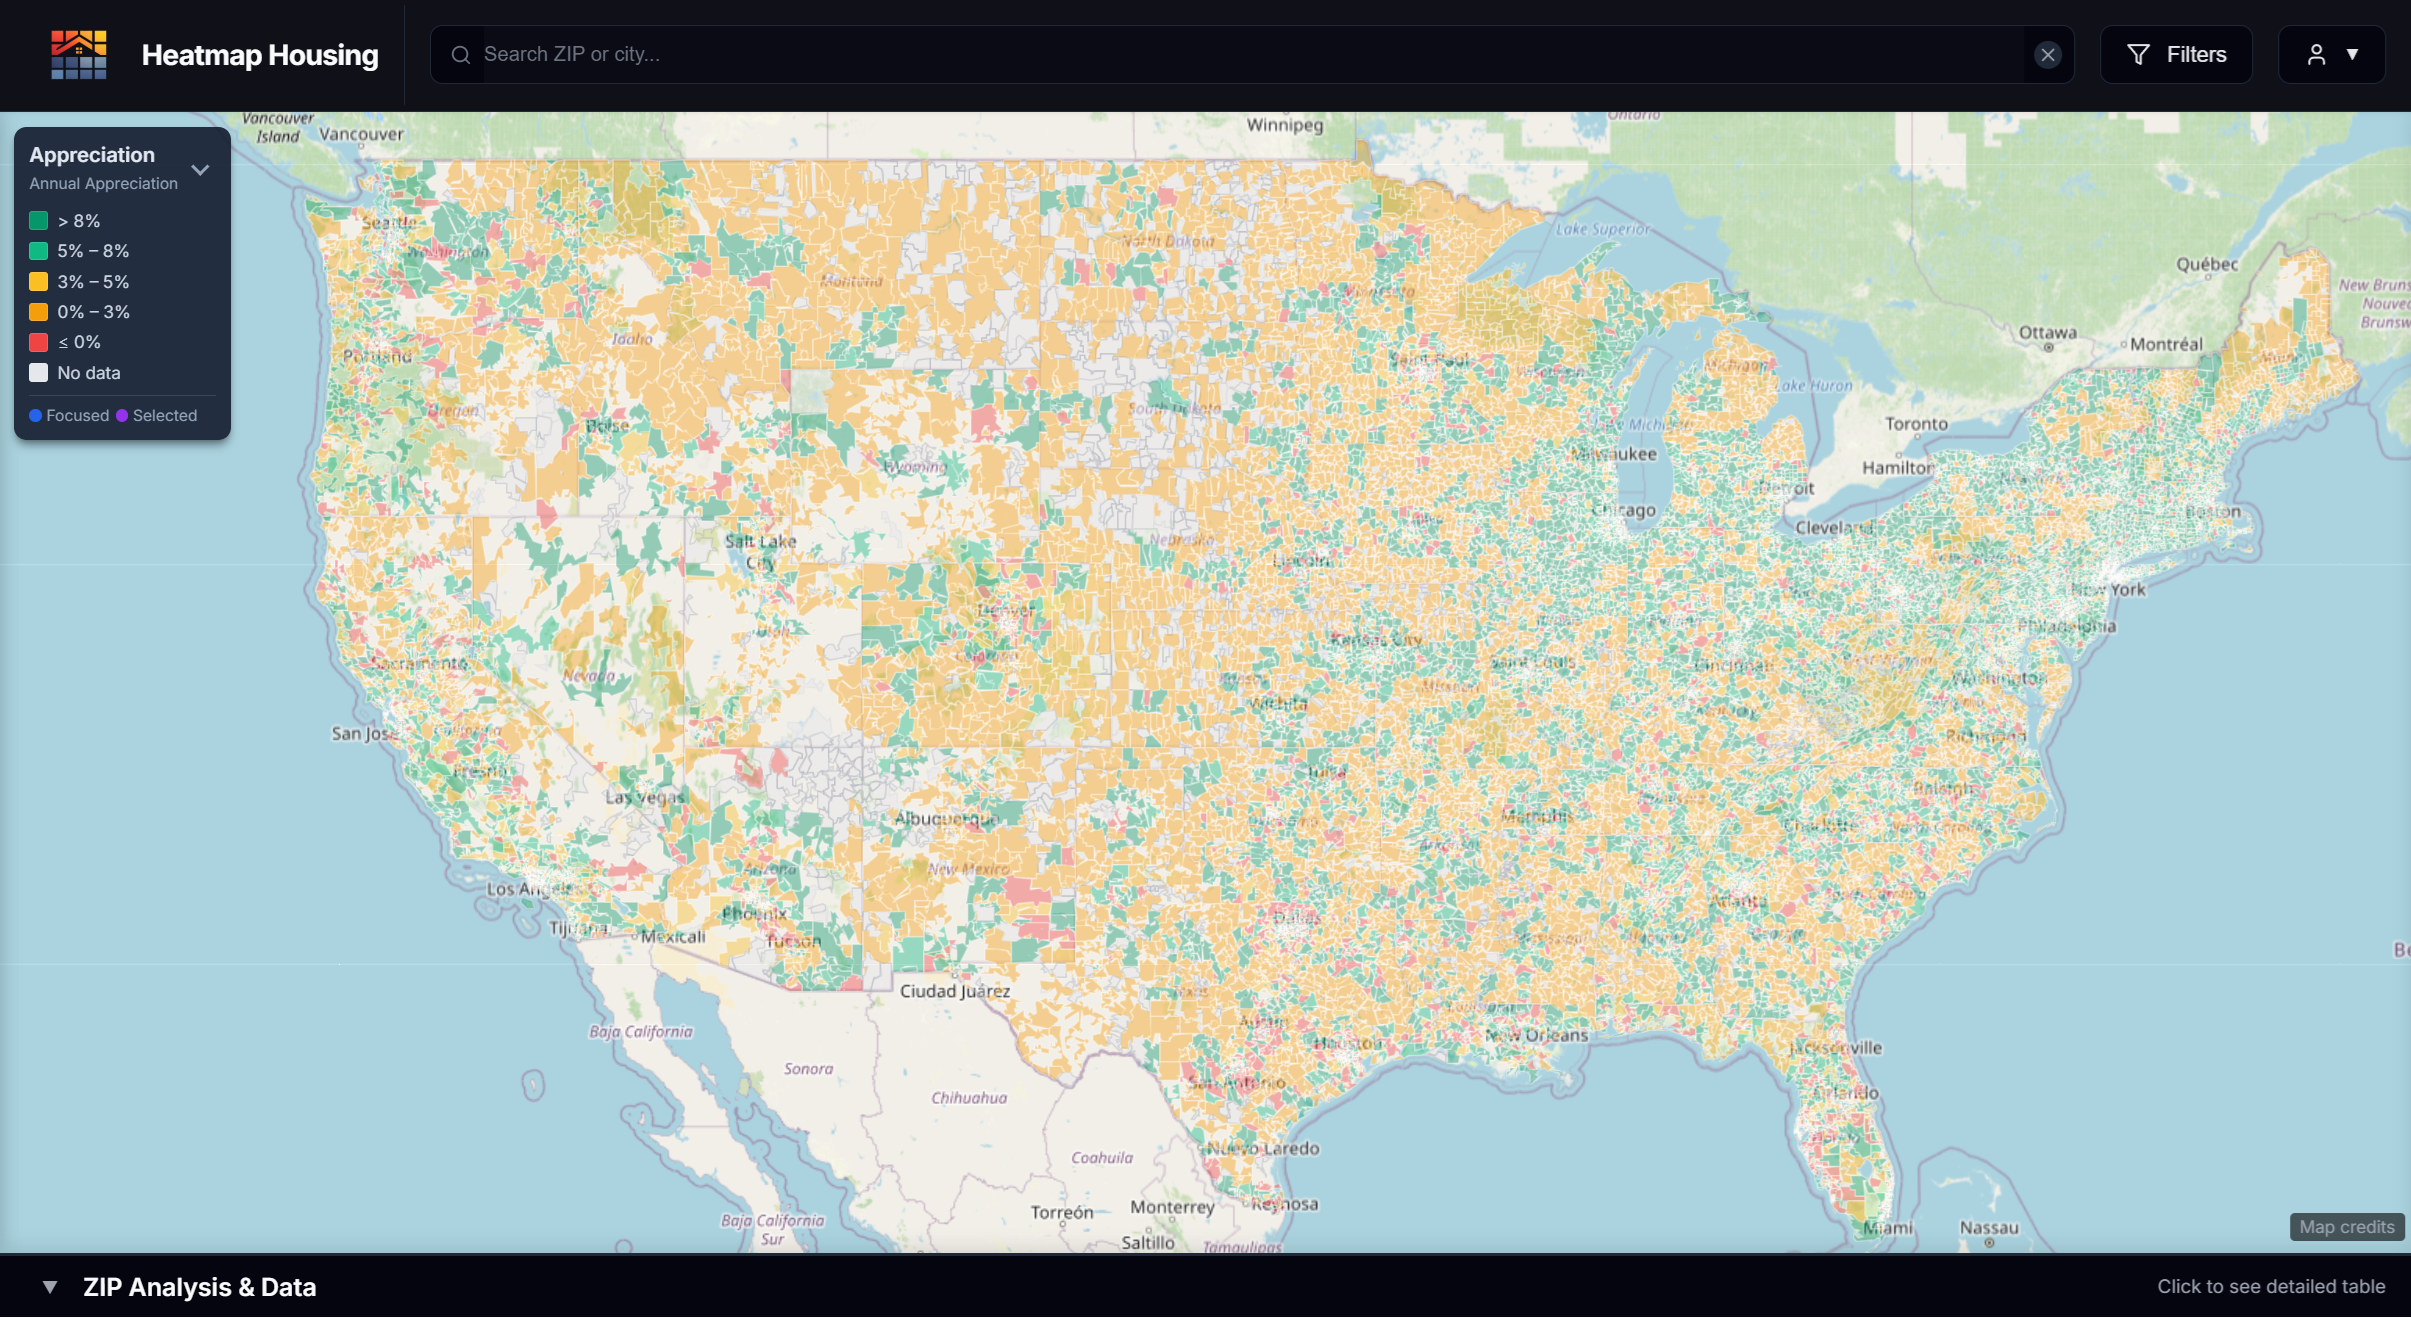
Market Discovery
- Scan the entire U.S. by ZIP code using cash flow, rent estimates, and investment criteria
- Filter by what matters — not just price
- Identify high-potential markets you wouldn’t find manually
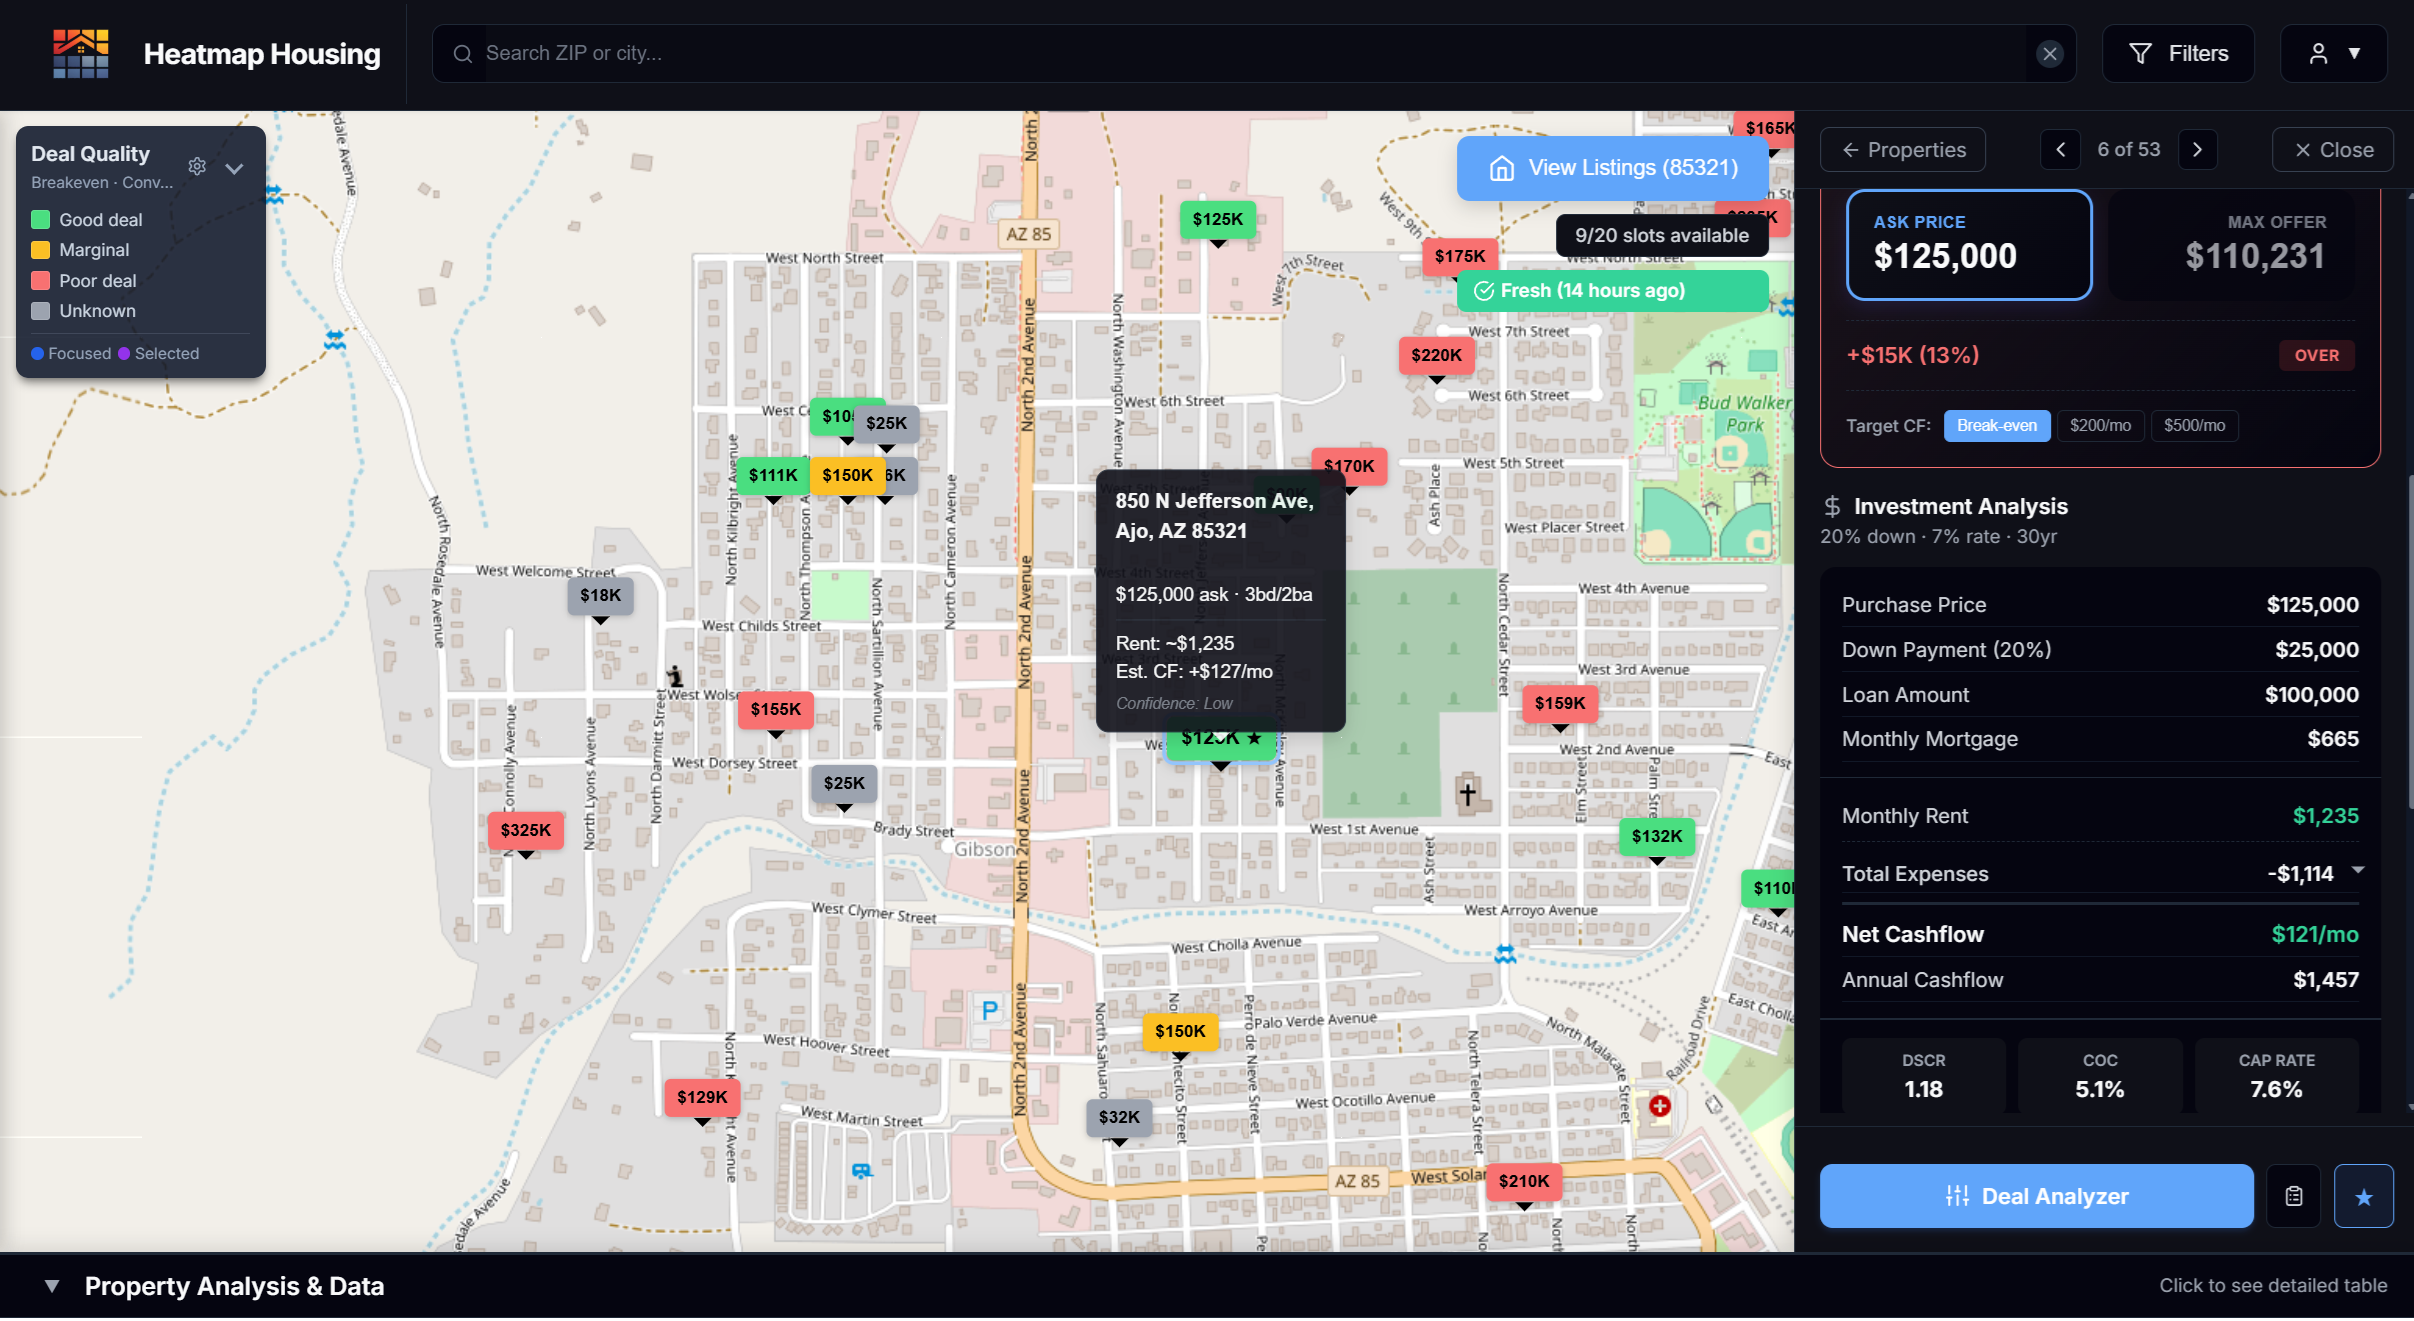
Instant Modeled Underwriting
- View projected cash flow, DSCR, and expense assumptions pre-filled
- Adjust inputs instead of building spreadsheets from scratch
- Every field shows its source and confidence level
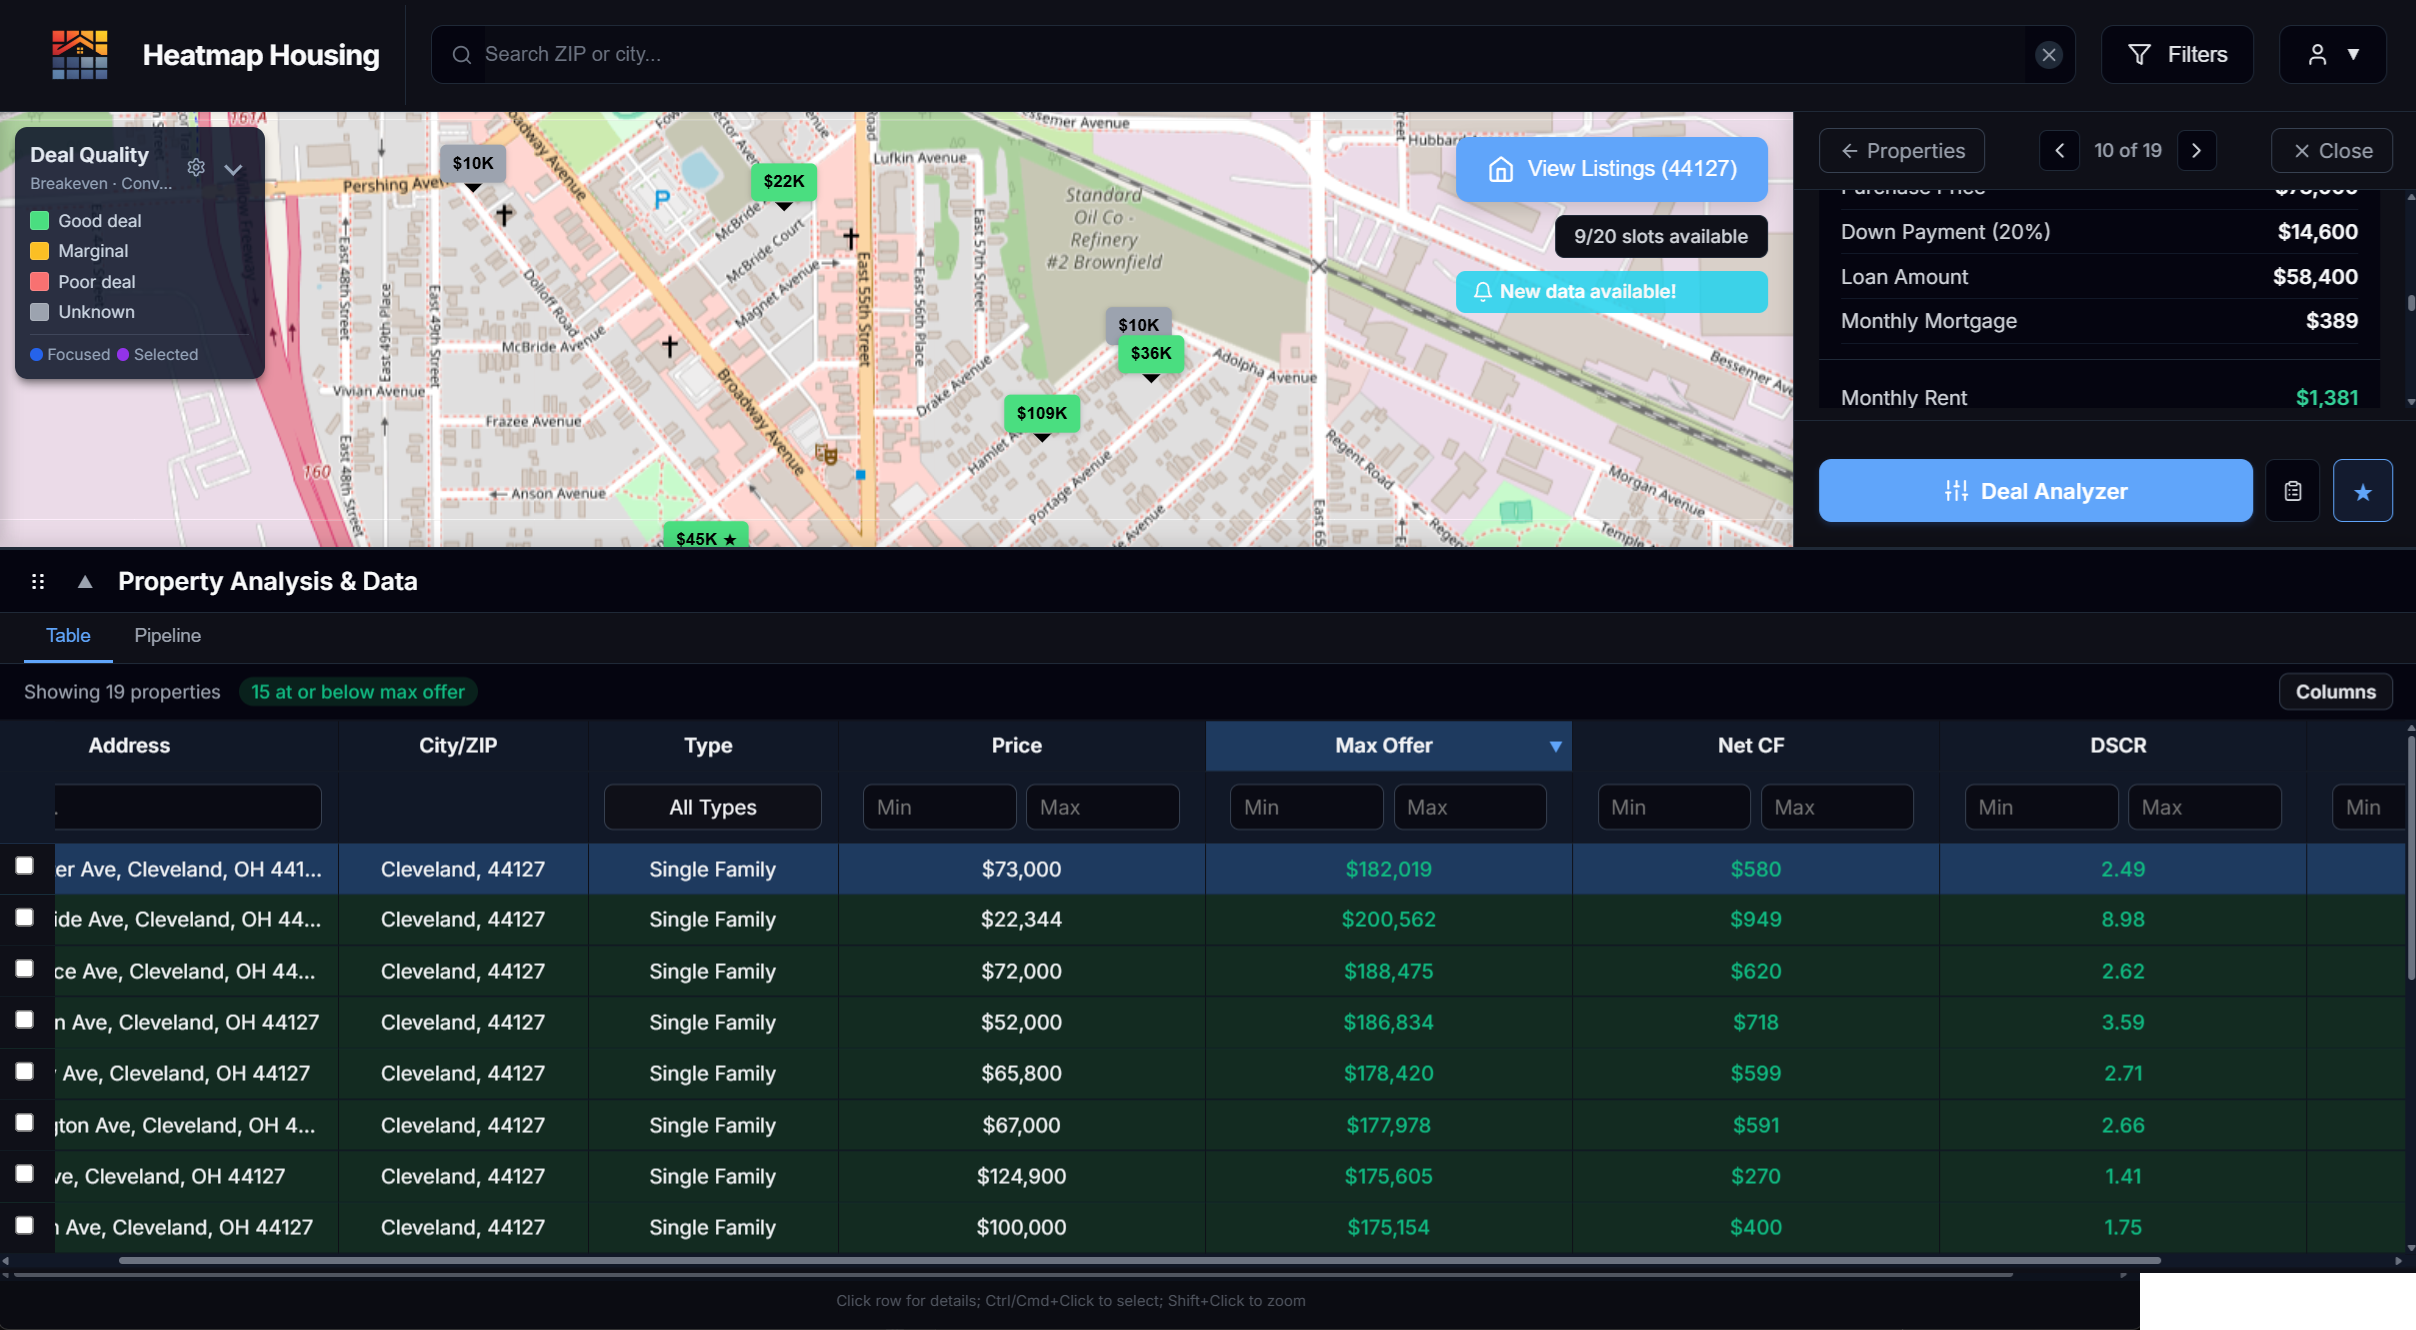
Property-Level Deep Dive (Pro)
- Analyze individual listings with rent comps and expense modeling
- Confidence indicators on every data point
- Override any value — the analysis recalculates instantly
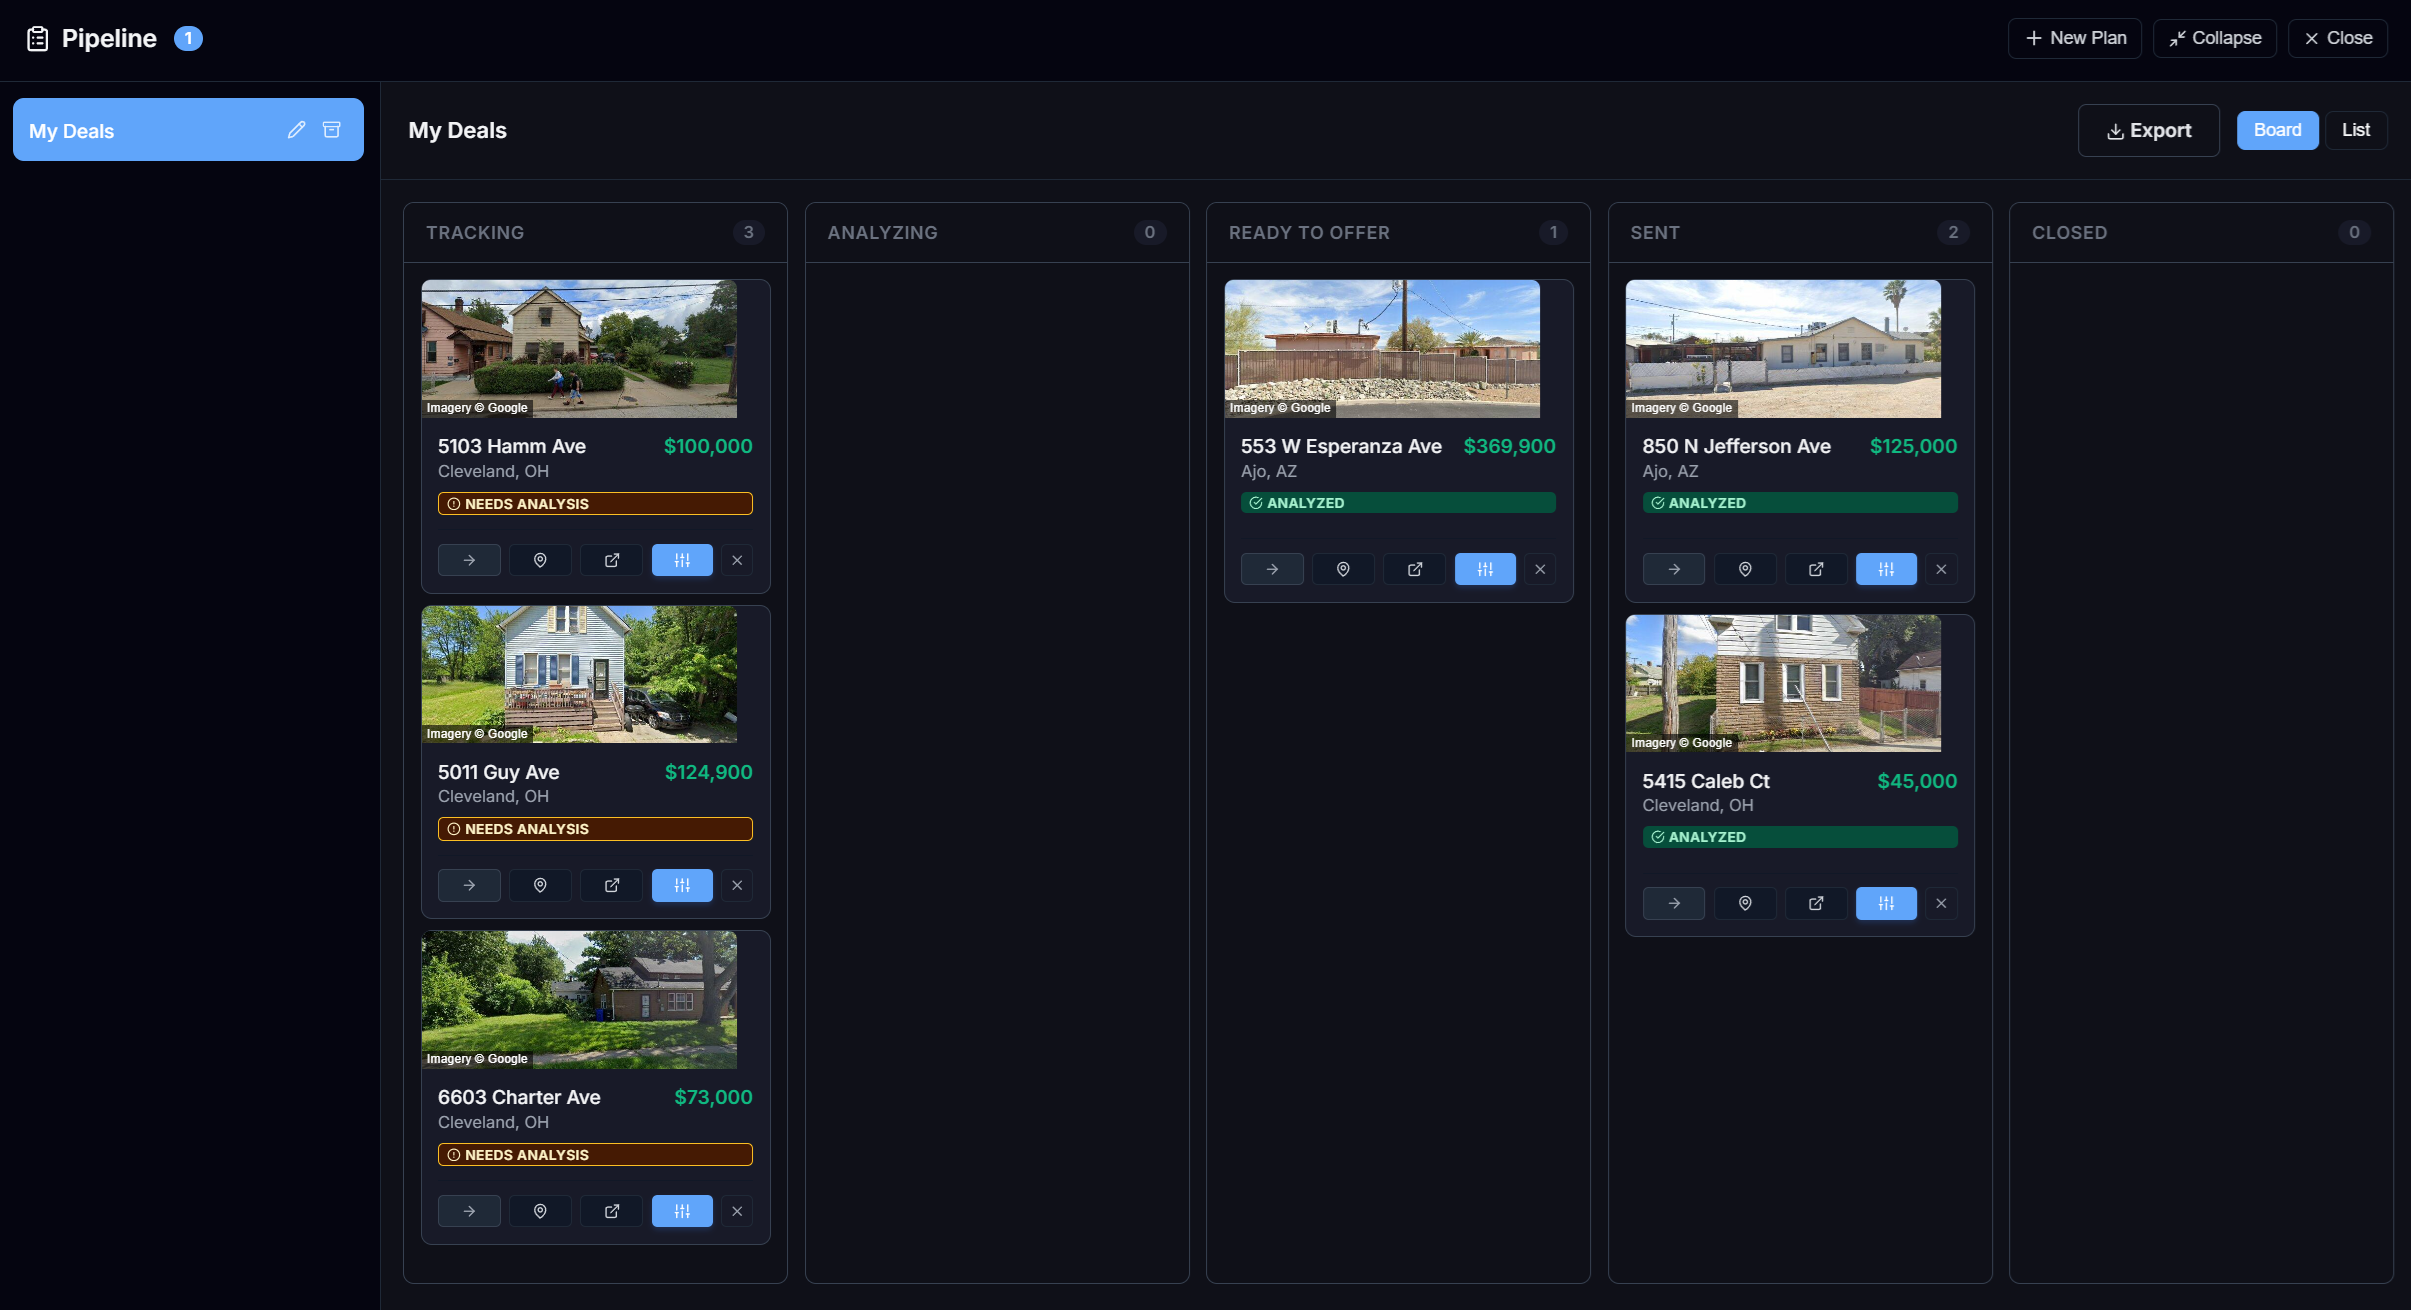
Export & Execute
- Download structured deal summaries
- Send clean, organized numbers to agents, partners, or lenders
- Track deals from discovery to close